Strategic Data Management across ALM Tools and ITSM Tools
What is the best option for using the same platform solution since starting and ending development and post-project?
KPI
7/30/20244 min read

Keywords:
Project Portfolio: A set of projects or programs and other work, grouped together to facilitate the effective management of that work in order to achieve strategic business objectives.
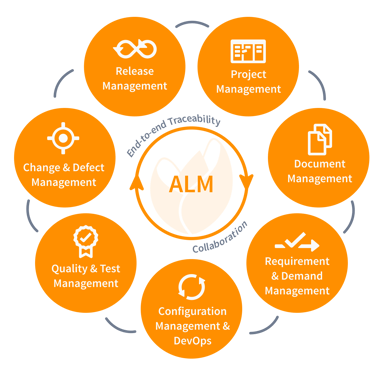
ALM Tools:
ALM is an acronym for Application Lifecycle Management. ALM refers to the governance process involving the management, development, and delivery of software, combining business management with software engineering
ITSM: IT service management, known by the acronym ITSM, is the tool that helps IT teams manage the end-to-end delivery of IT services to customers. It includes all processes and activities of designing, creating, delivering, and supporting IT services.
KPIs, Key Performance Indicators
To address this subject, it is essential to have already chosen a path to follow when you want to obtain consolidated information from your entire IT Governance process, from the beginning of a demand in its initial stage of maturity to the stage of post-design and improvement of a software product.
This theme considers the ease of obtaining information, integration and traceability of information between platforms, which the more related, the faster and more effective they will be.
In a governance restructuring model, we take into account that information already exists in different tools and platforms, but it is not always equalized and equivalent.
Imagine a product or solution that was generated in a portfolio of projects "X", with a unique identification number but started to be managed in another tool
Application Management ("Y"), went through the quality process in Tool "Z"), and finally delivered to a service team that uses a fourth IT Service Management tool.
At the end of the day, the company has different contracts and different identifications of that solution, and it is up to business intelligence to implement the quality and performance indicators.
The way in which data science will extract and treat this information is the most important factor for insight generation.
Question whether:
Does the Company have a single portfolio for solution management up to the Post-Project and Service stages?
Looking at the initial process of conception of the demand, is it possible to identify the expected maturity to move on to the next stage?
When the Product started its development cycle, is it already possible to obtain the degree of achievement in its previous phase to compare to the effort proposed in the current phase?
Right after the product is launched to the customer, what is the level of end-user satisfaction compared to the time, effort, and investment spent in the previous phases?
In the final layer, we go through the main stages of analysis, development and service of a solution, here is a BI Solution for integration between all platforms, triggering indicators that make sense to analyze the entire life cycle of the application, from the Ideation stage, to its shutdown or even receiving improvements, which must be reflected in the IT Services tools, going back to the development process and their respective phases until a new version of the product on the market.
Generating Indicators
The indicators must consider these changes between versions for monitoring and maturation of the solution, between the previous history and the current view
These differences between the past and the present contribute to the process of continuous improvement, justifying the effort at each stage of the process.
The Choice of Tool.
Let's say you were starting out in the global information technology market today, first before launching a product, it is important to establish adequate IT governance, roles, responsibilities and processes, as this is an important pillar for your goals. This is where control and management tools emerge.
Some companies decide to change their tools after years, unify solutions and generate a consolidated data source facilitating data extraction and management of indicators.
There is no perfect tool, each company has its own characteristic, what changes is the ease of traceability and the extraction of each one of them, making their equivalence between the platforms.
Which agile framework to use in my company?
There is no right choice, but the one that best fits the need that your company is going through now. Choose the one that best serves and that can benefit your production and that of employees, but don't forget that a tool is essential for the next steps
Atlassian X Power BI:
To justify the content mentioned above, currently Atlassian has been growing in the solutions market using tools that do all the application lifecycle management, from a robust portfolio, Framework, Quality Assurance and IT Services, all in a customizable way.
A unified solution that even offers On-Premises Indicators, but with an even greater ease of offering plugins for data extraction in tools such as Power BI,
for the implementation of indicators and Dashboards, using a traceable identification on your platform from the application, and all derivations in other identification items between all phases, ensuring all your history phase by phase.
This is a powerful strategy that allows you to collect, analyze, and visualize data in an improved way, providing valuable insights for decision-making and optimizing team performance. With this ability to make more informed decisions and gain strategic insights, this integration becomes indispensable in today's business environment.
Choosing the relevant indicators:
Understand the overall objectives of the business—after all, technology-specific indicators must align with these goals.
Ideally, they should provide sufficient information to make practical improvements.
Establish indicators that are realistic and achievable.
Use automated tools—which collect and analyze data—to facilitate this process.
Communicate and share metrics with the entire team.
Conclusion
Based on the information in this text, not only the importance of data traceability, as well as the necessary equivalence of the solution in data collection, but also a proposal for this integration to happen successfully, were presented. Remember to stay focused on relevant data when creating visualizations, avoiding unnecessary information pollution. With a proper Roadmap and framework in place, appropriate tools, and a robust Data Governance model, you are already taking a big step towards business success
B.I and Agile Solutions
Fortifying core business pillars, developing firms, integrating agile
Contact ( Provisory- Brazil)
Services
Tel: 55(41) 99134-1863
© 2024. All rights reserved.